Module 4: Functions (Chapter 3)
Section outline
-
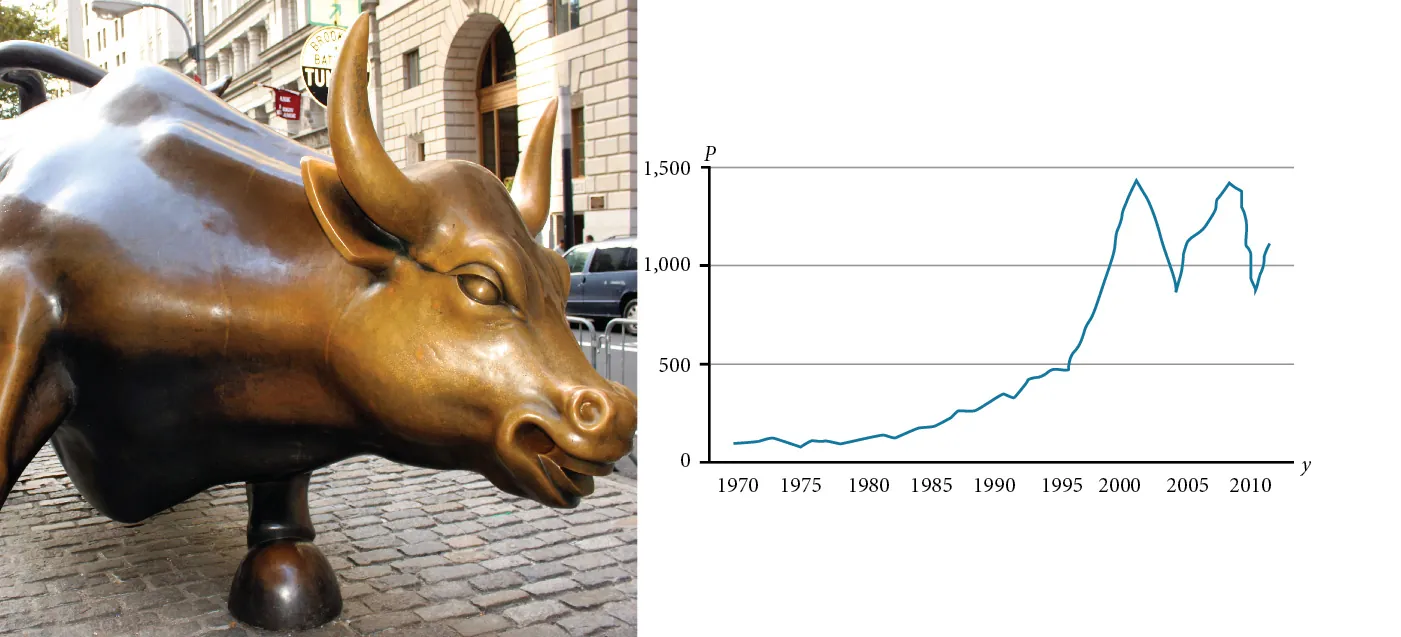
Toward the end of the twentieth century, the values of stocks of Internet and technology companies rose dramatically. As a result, the Standard and Poor’s stock market average rose as well. The graph above tracks the value of that initial investment of just under $100 over the 40 years. It shows that an investment that was worth less than $500 until about 1995 skyrocketed up to about $1100 by the beginning of 2000.
That five-year period became known as the “dot-com bubble” because so many Internet startups were formed. As bubbles tend to do, though, the dot-com bubble eventually burst. Many companies grew too fast and then suddenly went out of business. The result caused the sharp decline represented on the graph beginning at the end of 2000.
Notice, as we consider this example, that there is a definite relationship between the year and stock market average. For any year we choose, we can determine the corresponding value of the stock market average. In this chapter, we will explore these kinds of relationships and their properties.
Image Caption: Standard and Poor’s Index with dividends reinvested (credit "bull": modification of work by Prayitno Hadinata; credit "graph": modification of work by MeasuringWorth)
(Content & Image Source: Chapter 3 Introduction, College Algebra with Corequisite Support 2e, Jay Abramson & Sharon North, OpenStax, CC BY 4.0 License)
Upon completion of this module, you will be able to:
Section 3.R Polynomial Review (For use with co-requisite support)- Identify the degree and leading coefficient of polynomials.
- Add and subtract polynomials.
- Multiply polynomials.
- Perform operations with polynomials of several variables.
Section 3.1 The Rectangular Coordinate Systems and GraphsSection 3.2 Functions and Function Notation- Plot ordered pairs in a Cartesian coordinate system. (CLO4)
- Graph equations by plotting points. (CLO4, CLO6)
- Graph equations using a graphing calculator. (CLO4, CLO6)
- Find x-intercepts and y-intercepts. (CLO4, CLO6)
- Use the distance formula. (CLO3, CLO4)
- Use the midpoint formula. (CLO3, CLO4)
- Determine whether a relation represents a function. (CLO4)
- Find the value of a function. (CLO4)
- Determine whether a function is one-to-one. (CLO4)
- Use the vertical line test to identify functions. (CLO4, CLO5)
- Graph the functions listed in the library of functions. (CLO4, CLO5)
Section 3.3 Domain and RangeSection 3.4 Rates of Change and Behavior of Graphs- Find the domain of a function defined by an equation. (CLO4, CLO5)
- Graph piecewise-defined functions. (CLO4, CLO5, CLO6)
Section 3.5 Composition of Functions- Find the average rate of change of a function. (CLO4, CLO5)
- Use a graph to determine where a function is increasing, decreasing, or constant. (CLO4, CLO5)
- Use a graph to locate local maxima and local minima. (CLO4, CLO5)
- Use a graph to locate the absolute maximum and absolute minimum. (CLO4, CLO5)
Section 3.6 Transformation of Functions- Combine functions using algebraic operations. (CLO4, CLO5)
- Create a new function by composition of functions. (CLO4, CLO5)
- Evaluate composite functions. (CLO4, CLO5)
- Find the domain of a composite function. (CLO4, CLO5)
- Decompose a composite function into its component functions. (CLO4, CLO5)
Section 3.7 Absolute Value Functions- Graph functions using vertical and horizontal shifts. (CLO4, CLO5)
- Graph functions using reflections about the x-axis and the y-axis. (CLO4, CLO5)
- Determine whether a function is even, odd, or neither from its graph. (CLO4, CLO5)
- Graph functions using compressions and stretches. (CLO4, CLO5)
- Combine transformations. (CLO4, CLO5)
Section 3.8 Inverse Functions- Graph an absolute value function. (CLO4)
- Solve an absolute value equation. (CLO4)
- Verify inverse functions. (CLO4, CLO5)
- Determine the domain and range of an inverse function and restrict the domain of a function to make it one-to-one. (CLO4, CLO5)
- Find or evaluate the inverse of a function. (CLO4, CLO5)
- Use the graph of a one-to-one function to graph its inverse function on the same axes. (CLO4, CLO5)
(Note: Alignment of MLOs might be needed if this course is taught as a co-requisite.)To achieve these objectives:- Read the Module 4 Introduction (see above).
- Read Sections 3.R - 3.8 of Chapter 3: Functions in Applied Algebra (links to each Section provided below)
- At the end of each Section there is a list of Key Concepts, Section Exercises, and a Glossary of terms
- Complete the MyOpenMath Homework Assignments for each Section (links provided below) - These are graded!
- Complete the MyOpenMath Quiz for Chapter 3 (link provided below) - This is graded!
- Once you complete the Quiz, upload your work in the Quiz for Chapter 3 Work Upload Assignment using the submission link below.
- Post in the Chapter 3 Q&A Discussion Forum - link provided below.
- Complete the Digital Skills - Using the online graphing calculator (Chapter 3) (link provided below) - This is graded!
- Complete the Digital Skills - Using AI for math help (Chapter 3) (link provided below) - This is graded!
Note the check boxes to the right that help you track your progress: some are automatic, and some are manual.Module Pressbooks Resources and Activities
You will find the following resources and activities in this module at the Pressbooks website. Click on the links below to access or complete each item.
For select assessments in this course, students will be allowed to use the following links to online graphing calculators:
- Desmos Calculator
- TI-84 Calculator Online (free version, but not sure how long it will stay active)
- TI-84 Plus CE (*Note: This link requires a paid subscription to be purchased by the student using a credit card.)
-
-
-
Students mustMark as done
-
Background Colour
Font Face
Font Kerning
Font Size
Image Visibility
Letter Spacing
Line Height
Link Highlight
Text Colour